Search "Cape Elizabeth home prices" and you'll collect five different answers before lunch. One site says the median sale price is $843,000. Another says homes are listing for $1.13 million. A third gives you $965,000 for the trailing twelve months, while another page from that source lists a current median sale price of $880,350. A fourth, running its numbers through a forecasting model, lands at $840,624.
None of these sites made an error. They're all measuring the same small town, and that's precisely the problem. Cape Elizabeth sells so few homes in a given month that its median price behaves less like a stable market indicator and more like a coin flip weighted by whichever houses happened to close. If you're pricing a listing or sizing up an offer, treat a town-wide figure as one point of context.
Five Numbers, One Town
Here's what a snapshot of publicly available figures looked like across sources, each pulling from a slightly different window:
| Source | Metric | Value | Time Window |
|---|---|---|---|
| Portal A | Median sale price | $843,000 | January 2026 |
| Portal B | Median list price | $1,130,000 | July 2026 |
| Portal C | Median sale price, trailing 12 months | $965,000 | mid-2026 |
| Modeling service | Predicted median value | $840,624 | May 2026 |
| Portal C (separate page) | Current median sale price | $880,350 | 2026 |
The last two rows report different median-price figures from the same portal, with a difference of nearly $85,000. The figures use different measures and time windows, and the small number of transactions can make town-wide summaries vary.
Why Town-Wide Figures Vary
The mechanism is straightforward once you see it. In January 2026, four homes sold in Cape Elizabeth, down from nine in January 2025, and the average time on market stretched to 30 days from 19 the year before. With a sample of four, a single high-end oceanfront closing or a single modest inland fixer can swing the reported median by tens of thousands of dollars in either direction. Compare that to a market processing forty or fifty closings a month, where one unusual sale gets absorbed into the average and barely moves the needle.
This is why one source's price-per-square-foot figure showed a 15.5 percent jump year over year for early 2026, while another source's overall home-value estimate for the same stretch of time put annual growth at just 0.7 percent, essentially flat. These figures use different measures, and neither alone establishes what a specific house on a specific street is worth right now.
What the Town-by-Town Data Confirms
This isn't a Cape Elizabeth quirk. It's a pattern that shows up across every small, high-value coastal town once you stop looking at county rollups and start looking at the towns underneath them. A recent market stats report covering Cumberland County put it plainly: Scarborough's home sales rose 77 percent in a recent period while Cape Elizabeth's fell 22 percent over the same stretch, and Yarmouth's median jumped 38 percent while Kennebunkport's dropped by a fifth. The report's own conclusion is worth sitting with: the county number tells you where the market landed, but the town number tells you how it got there.
Cape Elizabeth's decline in that comparison wasn't a signal that the town lost value. It was a reflection of which four or five properties happened to close in a market that logged roughly 138 total home sales over the trailing twelve months, an average of about 11 closings a month. A county-level average smooths that volatility away. A single-town median doesn't have enough transactions to smooth anything.
Two Markets Wearing One Zip Code
There's a second reason the town-wide median misleads, and it has nothing to do with sample size. Cape Elizabeth isn't one market. It's two, filed under the same town name.
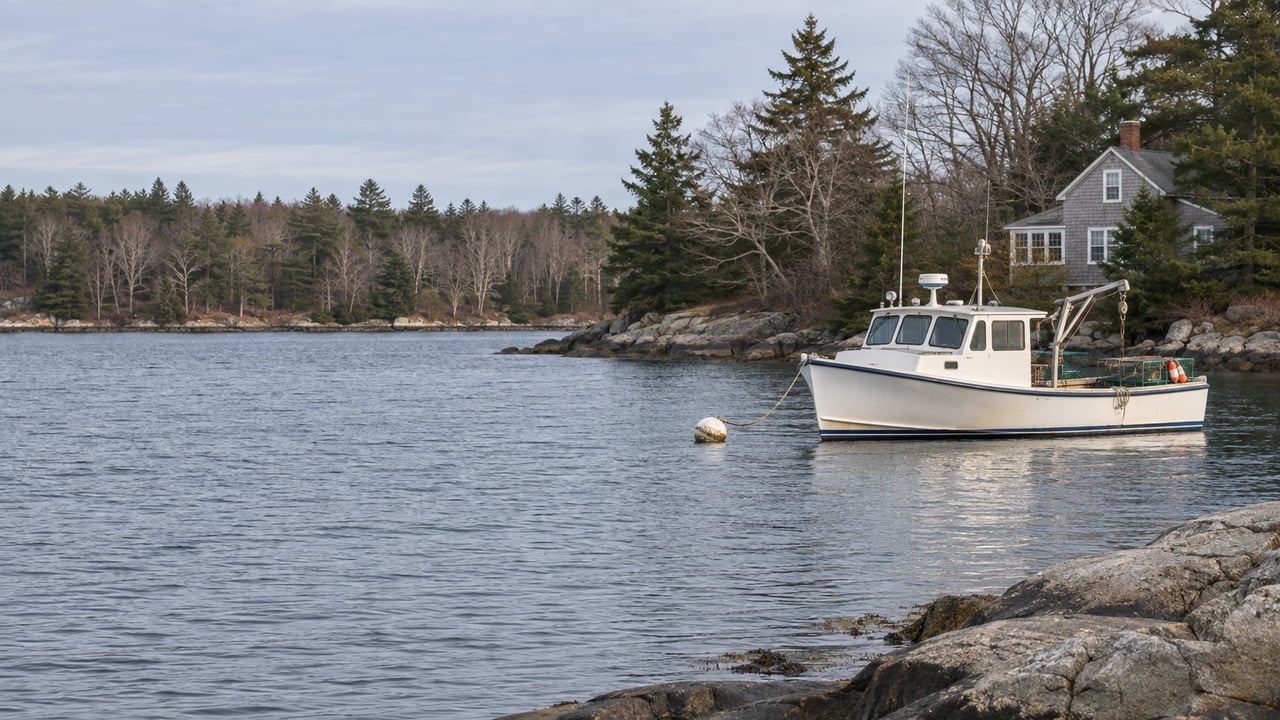
The oceanfront segment, clustered near landmarks like Two Lights State Park and Crescent Beach, sits on open Atlantic exposure over granite ledge, a fundamentally different physical relationship with the water than the sandy-beach coastal towns further south. In the prestige tier, active oceanfront listings have recently spanned $3.6 million to $16 million, and that spread alone tells you the oceanfront segment can't be reduced to a single midpoint. Meanwhile, inland Cape Elizabeth, in established neighborhoods like Cross Hill and newer subdivisions like Maxwell Woods, trades on a different set of comparables entirely: lot size, school proximity, commute distance, nothing to do with tidal exposure.
The two segments also face different regulatory realities. Oceanfront property in Cape Elizabeth falls within Maine's shoreland zone, which under the state's Mandatory Shoreland Zoning Act requires new construction and septic systems to maintain minimum setbacks, generally 75 to 100 feet, from the normal high-water line. That constrains what an oceanfront owner can expand or replace, which affects renovation costs, resale positioning, and how a buyer should think about a property's long-term flexibility. An inland home three miles away has none of that to navigate. Averaging the two into one town-wide median produces a figure that describes neither market accurately.
What to Check Instead of the Median
If a single number can't tell you much in a market this size, the alternative isn't guesswork. It's looking at the right inputs instead of the wrong one.
- Closed comparables in your actual segment. Oceanfront and inland sales shouldn't be blended. Ask what closed within the same geographic and physical category as the property you're evaluating, not the town as a whole.
- A tighter window than "trailing 12 months." A year-long average in a market this thin can still hide a swing that happened in the last 60 days. Ask what's closed most recently.
- List-to-sale ratio, not just list price. In a market with this few transactions, a home that sat and eventually sold below ask tells a different story than one that closed quickly at full price, even if both land near the same headline number.
- Shoreland zoning and septic history for waterfront property. Setback compliance and system age affect both what you can build and what a lender will want documented before closing.
- Days on market for the specific segment, not the town average, since oceanfront and inland properties can move at very different speeds even in the same month.
A Few Questions We Hear Often
Is now a good time to buy or sell in Cape Elizabeth? That depends entirely on which Cape Elizabeth you mean. Oceanfront supply is essentially fixed and rarely expands, while inland inventory responds more to broader rate and demand shifts. A single yes-or-no answer for the whole town isn't a real answer.
Why do portal figures vary? Sources report different measures and time windows, and a small number of monthly sales can make a median shift when new closing data is included.
How do I get a number I can actually trust? Ask someone tracking the specific closings in your segment, street by street, not a town-wide average built for scale rather than precision.
Cape Elizabeth's oceanfront and inland markets are distinct, so a town-wide median provides broad context rather than a property-specific valuation. If you're weighing a sale or sizing up what a property is really worth, McFarlane Field Associates has spent decades tracking these closings one at a time. Request Your Home Valuation and we'll walk through the actual comparables for your specific segment, not the town-wide blend.
This article is general information, not legal, tax or financial advice. Consult a qualified professional about your situation.